10 min read
Solid Observability in a Rust API: OpenTelemetry Traces, Prometheus Metrics, and Loki Logs
Date: 2026-09-25
Tags: observability, opentelemetry, tracing, prometheus, loki, tempo, grafana, rust, actix-web
Hello,
I've been working on a project with a Rust API server and wanted to share how I implemented some solid observability.
I wanted to build a foundation where I could actually see what happens in production — not just println! or grepping through container logs, but something solid. So I ended up implementing OpenTelemetry for traces, Prometheus for metrics, and Loki for logs, and I thought I'd share how I did it. Hopefully someone finds it useful!
Stack
opentelemetry0.32 +opentelemetry_sdk0.32 +opentelemetry-otlp0.32tracing+tracing-subscriber+tracing-opentelemetry0.33opentelemetry-appender-tracing0.32- Tempo for traces
- Prometheus for metrics
- Loki + Promtail for logs
- Grafana to view everything
Here's the relevant slice of Cargo.toml:
opentelemetry = { version = "0.32", features = ["trace", "metrics", "logs"] }
opentelemetry_sdk = { version = "0.32", features = ["trace", "metrics", "logs", "rt-tokio"] }
opentelemetry-otlp = { version = "0.32", features = ["grpc-tonic", "trace", "metrics", "logs"] }
opentelemetry-appender-tracing = "0.32"
tracing = { version = "0.1", features = ["log"] }
tracing-subscriber = { version = "0.3", features = ["env-filter", "json"] }
tracing-opentelemetry = "0.33"
prometheus = "0.13"
How it works
The app exports traces via OTLP/gRPC directly to Tempo. Metrics are exposed on a /metrics endpoint that Prometheus scrapes. Logs are collected from the Docker containers by Promtail and pushed to Loki. Grafana connects to all three as datasources.
App ──(OTLP/gRPC :4317)──► Tempo ──(remote_write)──► Prometheus
App ──(/metrics scrape)──────────────────────────────► Prometheus
Docker logs ──► Promtail ──► Loki

Grafana ──► Tempo (traces)
        ──► Prometheus (metrics)
        ──► Loki (logs)
Tempo's metrics generator also derives service-graph and span metrics from the traces and remote-writes them into Prometheus, so the same trace data feeds both the trace view and the metrics view (tempo-config.yml):
metrics_generator:
  processor:
    service_graphs: {}   # service graph metrics
    span_metrics:        # RED metrics derived from spans
      enable_target_info: true
  storage:
    remote_write:
      - url: http://prometheus:9090/api/v1/write
        send_exemplars: true
Prometheus scrapes each binary's /metrics endpoint (prometheus.yml):
scrape_configs:
  - job_name: "jambo-backend"
    static_configs:
      - targets: ["backend:5000"]
    metrics_path: /metrics

  - job_name: "jambo-ai-worker"
    static_configs:
      - targets: ["ai-worker:7000"]
    metrics_path: /metrics

  - job_name: "jambo-scheduler-worker"
    static_configs:
      - targets: ["scheduler-worker:6000"]
    metrics_path: /metrics
Tracing setup
On startup I initialize a TracerProvider with an OTLP span exporter and wire it into the tracing subscriber as a layer. This lives in init_tracing():
pub fn init_tracing(service_name: &str) {
    let otlp_endpoint =
        std::env::var("OTEL_EXPORTER_OTLP_ENDPOINT").unwrap_or_else(|_| "http://tempo:4317".into());

    let exporter = SpanExporter::builder()
        .with_tonic()
        .with_endpoint(&otlp_endpoint)
        .build()
        .expect("Failed to build OTLP span exporter");

    let provider = SdkTracerProvider::builder()
        .with_batch_exporter(exporter)
        .with_resource(
            Resource::builder()
                .with_service_name(service_name.to_string())
                .build(),
        )
        .build();

    let tracer = provider.tracer(service_name.to_string());
    let telemetry_layer = tracing_opentelemetry::layer().with_tracer(tracer);

    let env_filter = tracing_subscriber::EnvFilter::try_from_default_env()
        .unwrap_or_else(|_| tracing_subscriber::EnvFilter::new("info"));

    tracing_subscriber::registry()
        .with(env_filter)
        .with(tracing_subscriber::fmt::layer().json())
        .with(telemetry_layer)
        .init();

    opentelemetry::global::set_tracer_provider(provider);
    opentelemetry::global::set_text_map_propagator(
        opentelemetry_sdk::propagation::TraceContextPropagator::new(),
    );
}
A few things worth calling out:
- The exporter uses
with_tonic()(gRPC) and points at Tempo's OTLP receiver on:4317. with_batch_exporterbatches spans instead of exporting one-by-one, which keeps the hot path cheap.- The
Resourcecarries the service name, so every span is tagged with which binary produced it (backend,ai-worker,scheduler-worker). - The
TraceContextPropagatoris installed globally so W3Ctraceparent/tracestateheaders can be injected and extracted across process boundaries. - The subscriber keeps a JSON fmt layer for stdout and the OpenTelemetry layer, so logs stay greppable locally while spans flow to Tempo.
HTTP request spans
Every request goes through a middleware that creates a span and records the outcome. The span is created up front with Empty fields, then those fields are filled in after the response is produced (middleware.rs):
let span = tracing::info_span!(
    "http_request",
    correlation_id = %correlation_id,
    http.method = %method,
    http.path = %path,
    http.status_code = tracing::field::Empty,
    http.duration_ms = tracing::field::Empty,
    http.error_message = tracing::field::Empty,
);
The middleware also accepts an incoming X-Request-Id or X-Correlation-Id header (or generates a fresh UUID), stores it in request extensions so handlers can read it, and echoes it back on the response as x-request-id.
After the future resolves, the fields are recorded while the span is still active:
let _guard = span.enter();
let result = fut.await;
let duration = start.elapsed();

span.record("http.duration_ms", duration.as_millis() as u64);
span.record("http.status_code", status_code);
One subtlety: I enter the span manually with span.enter() rather than using .instrument() on the future. With .instrument() the span is exited before I get a chance to record() the status code and duration, so the fields would stay empty. Entering manually keeps the span active across the await and the subsequent record() calls.
Keeping cardinality under control
The raw path contains IDs (/api/game/8f3c.../play), which would explode the number of distinct metric label values. So before recording metrics, the middleware normalizes UUID path segments to {id}:
let path_segments: Vec<&str> = path.split('/').collect();
let normalized_path = if path_segments.len() >= 4 && path_segments[1] == "api" {
    let parts: Vec<&str> = path_segments
        .iter()
        .map(|seg| {
            if Uuid::parse_str(seg).is_ok() {
                "{id}"
            } else {
                seg
            }
        })
        .collect();
    parts.join("/").to_string()
} else {
    path.clone()
};
So /api/game/8f3c.../play becomes /api/game/{id}/play, and the label space stays bounded.
Metrics: the RED method
Metrics use the prometheus crate directly. The two core HTTP metrics are a counter and a histogram (metrics.rs):
pub static HTTP_REQUESTS_TOTAL: Lazy<CounterVec> = Lazy::new(|| {
    register_counter_vec!(
        "http_requests_total",
        "Total number of HTTP requests",
        &["method", "path", "status"]
    )
    .unwrap()
});

pub static HTTP_REQUEST_DURATION_SECONDS: Lazy<HistogramVec> = Lazy::new(|| {
    register_histogram_vec!(
        "http_request_duration_seconds",
        "HTTP request duration in seconds",
        &["method", "path"],
        vec![0.005, 0.01, 0.025, 0.05, 0.1, 0.25, 0.5, 1.0, 2.5, 5.0, 10.0]
    )
    .unwrap()
});
After each request completes, the middleware records rate and duration:
metrics::HTTP_REQUESTS_TOTAL
    .with_label_values(&[method_str, &normalized_path, &status_code.to_string()])
    .inc();

metrics::HTTP_REQUEST_DURATION_SECONDS
    .with_label_values(&[method_str, &normalized_path])
    .observe(duration.as_secs_f64());
That gives the Rate and Duration of the RED method. For Errors, the status code is already a label on http_requests_total, so you can slice it in PromQL:
# error rate
sum(rate(http_requests_total{status=~"5.."}[5m]))
  / sum(rate(http_requests_total[5m]))

# p95 latency by route
histogram_quantile(
  0.95,
  sum(rate(http_request_duration_seconds_bucket[5m])) by (le, path)
)
Beyond HTTP, the same pattern covers the rest of the system: game lifecycle, AI task duration, bot errors, scheduler task health, database pool gauges, Redis cache hit ratio, and payment operations. There are dedicated counters for the things that tend to fail silently — bot_chain_fallback_total, games_stalled_total, redis_buffer_overflow_total, circuit_breaker_state.
Pre-registering series
One gotcha with the prometheus crate: a CounterVec/HistogramVec with no observed label combination exports nothing, so a dashboard panel or alert referencing it shows "no data" until the first event happens. To avoid that, metrics_init::init_all() touches every metric with its known label values at startup:
pub fn init_all() {
    HTTP_REQUESTS_TOTAL.with_label_values(&["GET", "/health", "200"]);
    HTTP_REQUEST_DURATION_SECONDS.with_label_values(&["GET", "/health"]);
    GAMES_FINISHED_TOTAL.with_label_values(&["finished"]);
    AI_TASK_DURATION_SECONDS.with_label_values(&["ai_task"]);
    // ... every other metric + label combination
}
Now every series exists from boot, and alerts don't fire on missing data.
Propagating traces across RabbitMQ
The interesting part of this system is that a card play can hop from the API process to the AI worker process. To keep it one trace, the trace context is injected into the AMQP message headers when publishing, and extracted on the consumer side.
The injector/extractor wrap a lapin FieldTable (propagation.rs):
pub struct AmqpInjector<'a>(pub &'a mut FieldTable);

impl Injector for AmqpInjector<'_> {
    fn set(&mut self, key: &str, value: String) {
        self.0.insert(key.into(), AMQPValue::LongString(value.into()));
    }
}

pub struct AmqpExtractor<'a>(pub &'a FieldTable);

impl Extractor for AmqpExtractor<'_> {
    fn get(&self, key: &str) -> Option<&str> {
        self.0.inner().get(key).and_then(|value| match value {
            AMQPValue::LongString(s) => std::str::from_utf8(s.as_bytes()).ok(),
            _ => None,
        })
    }
    // ...
}
Injection uses the current tracing span's context, not the ambient Context::current():
pub fn inject_headers() -> FieldTable {
    let parent_cx = tracing::Span::current().context();
    let mut headers = FieldTable::default();
    opentelemetry::global::get_text_map_propagator(|propagator| {
        propagator.inject_context(&parent_cx, &mut AmqpInjector(&mut headers));
    });
    headers
}
This is deliberate: the tracing-opentelemetry layer isn't configured with context activation, so Context::current() wouldn't be the span's context. Pulling it off Span::current() is what actually gives you the right traceparent.
On the consumer side, the worker extracts the context from the delivery headers and links its span to it:
let parent_context = propagation::extract_context(delivery.properties.headers());
let result = process_bot_move(task, db, redis, Some(rmq), parent_context).await;
And inside process_bot_move, the new span is parented to that extracted context (worker_core.rs):
let span = tracing::info_span!(
    "ai_task",
    correlation_id = %correlation_id.map(|id| id.to_string()).unwrap_or_default(),
    game_id = %game_id,
    player_id = %player_id,
);
// Link this span into the producer's trace (distributed context from the message headers).
let _ = span.set_parent(parent_context);
let _guard = span.enter();
Now the HTTP request and the bot's move show up as a single trace in Tempo, even though they ran in different processes.
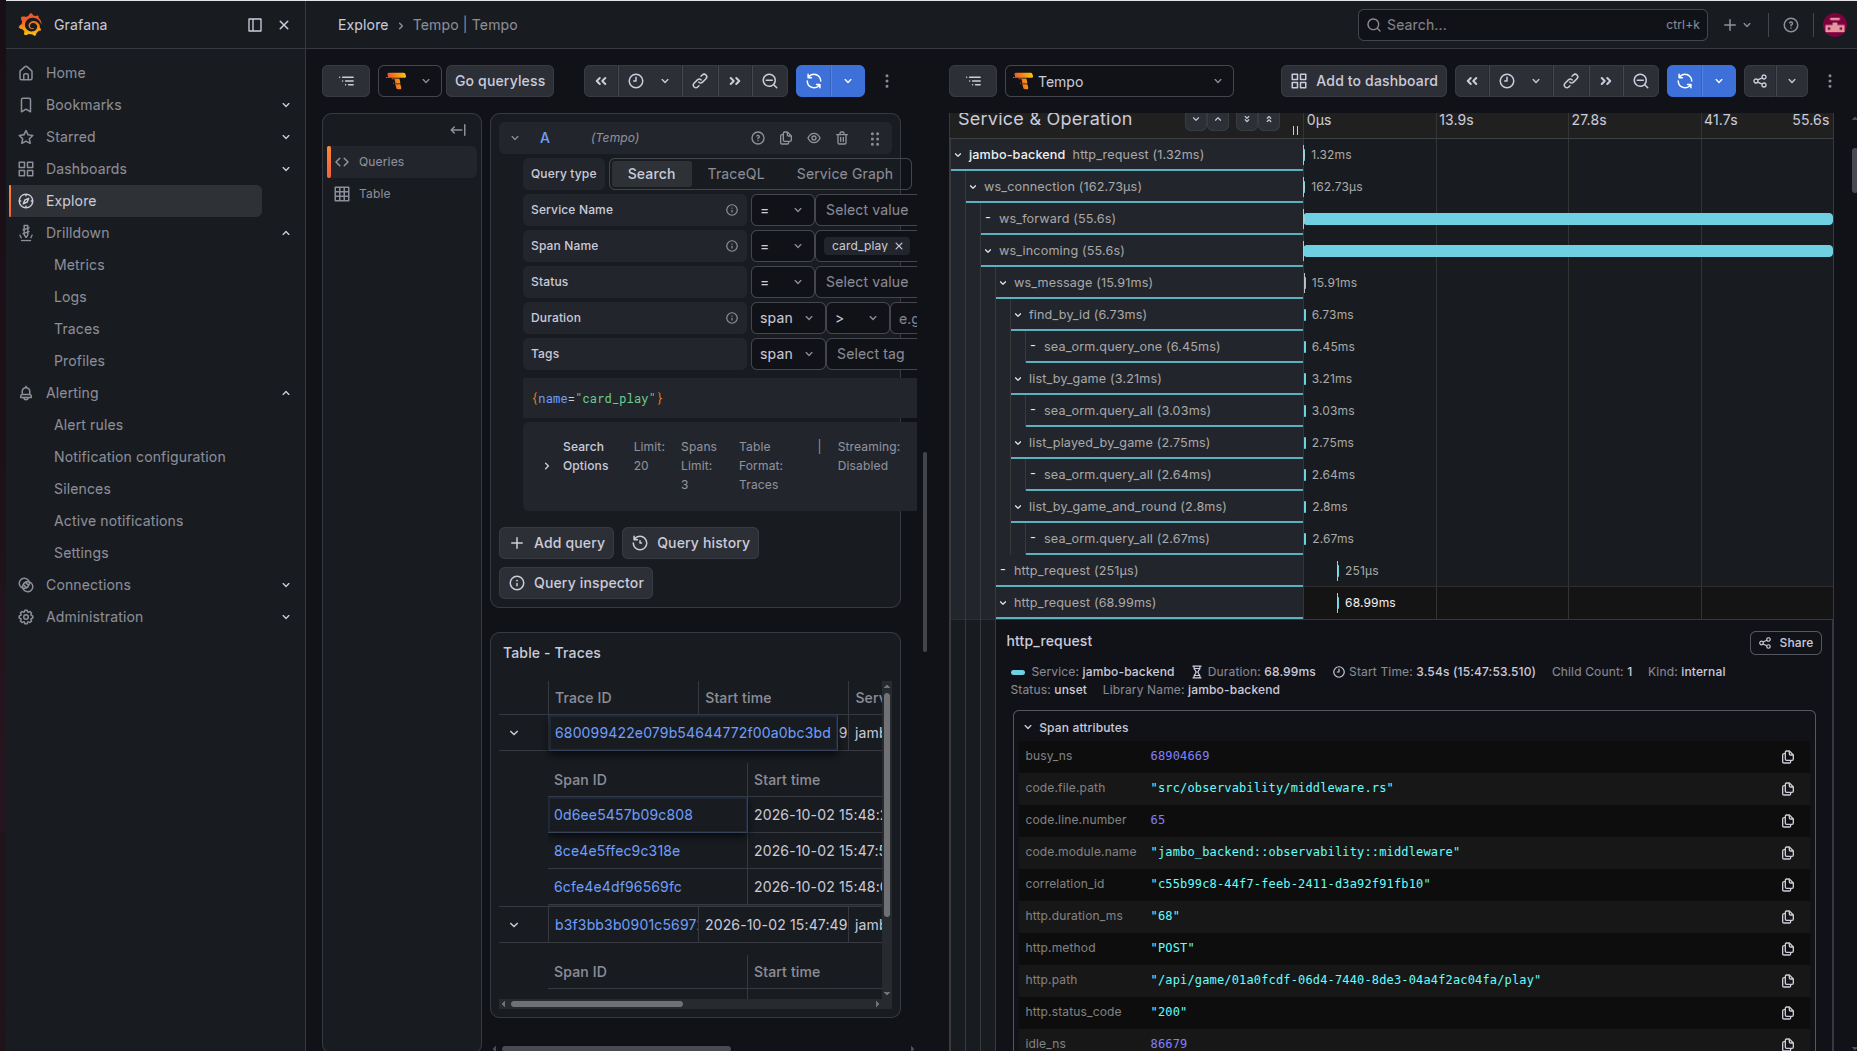
A trace from a card play
Here's what a single card play looks like end to end. The client calls POST /api/game/{id}/play, and the trace threads through both processes.
1. HTTP entry. The middleware opens the http_request span with the correlation ID, method, and path.
2. Handler. play_card pulls the correlation ID out of request extensions and calls the service:
let correlation_id = req.extensions().get::<CorrelationId>().copied();

match orchestrator
    .play_card(game_id, payload.player_id, payload.card_index, correlation_id, idempotency_key)
    .await
{ /* ... */ }
3. Service. GamePlayService::play_card is instrumented, so it produces its own span with the game, player, and card index:
#[tracing::instrument(
    level = "info",
    skip(self),
    fields(
        correlation_id = %correlation_id.map(|c| c.to_string()).unwrap_or_default(),
        game_id = %game_id,
        player_id = %player_id,
        card_index = card_index
    )
)]
async fn play_card(/* ... */) -> Result<PlayCardOutcome, GameError> { /* ... */ }
4. Card play. update_card_play opens a card_play span and runs the whole thing inside a transaction with optimistic-lock retries:
let _timer = CardPlayTimer(Instant::now());
let span = tracing::info_span!(
    "card_play",
    correlation_id = %correlation_id.map(|id| id.to_string()).unwrap_or_default(),
    game_id = %game_id,
    player_id = %player_id,
    card_index = card_index,
);
let _guard = span.enter();
The CardPlayTimer guard records into card_play_duration_seconds when it drops, so the metric and the span line up.
5. Bot scheduling. If the next player is a bot, schedule_if_next_bot builds an AI task and publishes it:
#[tracing::instrument(
    level = "info",
    skip(self),
    fields(
        correlation_id = %correlation_id.map(|c| c.to_string()).unwrap_or_default(),
        game_id = %game_id,
        next_player = %next_player
    )
)]
pub async fn schedule_if_next_bot(/* ... */) { /* ... */ }
6. Publish with context. publish_ai_task opens a publish_ai_task span and injects the trace headers into the message:
pub async fn publish_ai_task(&self, task: &AITask) -> Result<(), lapin::Error> {
    let span = tracing::info_span!(
        "publish_ai_task",
        correlation_id = %task.correlation_id.map(|id| id.to_string()).unwrap_or_default(),
        game_id = %task.game_id,
        player_id = %task.player_id,
    );
    let _guard = span.enter();
    let headers = crate::observability::propagation::inject_headers();
    self.publish_with_retry(AI_TASKS_QUEUE, &task.to_json_bytes(), headers)
        .await
}
7. Worker picks it up. The AI worker extracts the parent context from the headers and processes the task, producing the ai_task span parented to the original trace. It then calls update_card_play again for the bot's move — which opens another card_play span, still inside the same trace.
The result is a waterfall that spans both processes: http_request → play_card → card_play → schedule_if_next_bot → publish_ai_task → ai_task → card_play. If the bot's move stalls, you can see exactly which span is slow or missing.
What this gives you
- Traces that cross process boundaries, so a request that touches the API, RabbitMQ, and the AI worker is one waterfall instead of three disconnected log streams.
- Metrics with bounded cardinality, pre-registered at boot, covering HTTP RED plus game, bot, scheduler, DB pool, Redis, and payment health.
- Logs aggregated centrally, queryable with LogQL across every service.
- Correlation in Grafana: spot a latency spike on a Prometheus panel, jump to the time range in Loki, find the correlation ID, then open the full trace in Tempo.