10 min read
Debugging a 504 Gateway Timeout: When Docker Multi-Network DNS Strikes
Date: 2026-06-22
Tags: docker, networking, dns, traefik, nginx, debugging
The Observation
It started with a simple check: the monitoring dashboard was down. Our Dozzle container logs viewer — which we rely on daily — was returning a 504 Gateway Timeout. Here's what the access log showed:
86.250.65.182 - - [21/Jun/2026:21:03:59 +0000]
  "GET /dozzle/ HTTP/3.0" 504 15 "-" "-" 20760
  "https-0-ueuosv4cq32p3zybvy8i24ju-monitoring-nginx@docker"
  "http://192.168.96.5:8888" 30003ms
Key observations from this single line:
- 504 Gateway Timeout — the upstream never responded within the timeout window.
- 30003ms — roughly 30 seconds, the default timeout before giving up.
- Upstream target:
http://192.168.96.5:8888— an IP on the192.168.96.0/20subnet. - Client: Traefik (Coolify's proxy), acting as the external reverse proxy.
The Traefik logs confirmed the worst:
{
  "level": "debug",
  "error": "dial tcp 192.168.96.5:8888: i/o timeout",
  "time": "2026-06-21T21:05:00Z",
  "caller": ".../proxy.go:121",
  "message": "504 Gateway Timeout"
}
The TCP connection itself was timing out. The port wasn't accepting connections.
The Architecture
Before diving into the fix, let's understand the request flow:
Client ──► Traefik (Coolify proxy) ──► monitoring-nginx (:8888) ──► dozzle (:8080)
                                                                 └──► prometheus (:9090)
Our infrastructure uses:
- Traefik as the edge reverse proxy (managed by Coolify)
- monitoring-nginx as an internal Nginx that adds basic auth and routes to monitoring tools
- Dozzle for real-time Docker container logs
- Prometheus for metrics
The Nginx config proxied to upstream services by Docker service name:
The Investigation
First Hypothesis: Dozzle crashed
The most obvious suspect: Dozzle itself was down. Maybe an OOM kill, maybe a permission issue with /var/run/docker.sock. But docker ps showed Dozzle was running fine. Its logs showed no errors.
Second Hypothesis: monitoring-nginx crashed
Same story — Nginx was up, accepting connections, no errors in its logs.
Third Hypothesis: Docker network issue
This is where it got interesting. We inspected the Docker networks and found three networks, not two:
$ sudo docker network ls
NETWORK ID     NAME
288f0d1a41ff   ueuosv4cq32p3zybvy8i24ju_monitoring
bf18e46dfd36   ueuosv4cq32p3zybvy8i24ju_internal
4676187d6155   ueuosv4cq32p3zybvy8i24ju
Let's look at each one.
Network 1: monitoring (192.168.80.0/20)
{
    "Name": "ueuosv4cq32p3zybvy8i24ju_monitoring",
    "Driver": "bridge",
    "IPAM": { "Subnet": "192.168.80.0/20" },
    "Internal": false,
    "Containers": {
        "dozzle":       "192.168.80.2/20",
        "prometheus":   "192.168.80.3/20",
        "monitoring-nginx": "192.168.80.4/20",
        "backend":      "192.168.80.5/20"
    }
}
Network 2: internal (192.168.96.0/20)
{
    "Name": "ueuosv4cq32p3zybvy8i24ju_internal",
    "Driver": "bridge",
    "IPAM": { "Subnet": "192.168.96.0/20" },
    "Internal": true,
    "Containers": {
        "postgres":          "192.168.96.3/20",
        "redis":             "192.168.96.4/20",
        "monitoring-nginx":  "192.168.96.5/20",
        "rabbitmq":          "192.168.96.2/20",
        "scheduler-worker":  "192.168.96.6/20",
        "ai-worker":         "192.168.96.7/20",
        "backend":           "192.168.96.8/20",
        "frontend":          "192.168.96.9/20"
    }
}
Network 3: Coolify's default network (192.168.240.0/20)
{
    "Name": "ueuosv4cq32p3zybvy8i24ju",
    "Driver": "bridge",
    "IPAM": { "Subnet": "192.168.240.0/20" },
    "Internal": false,
    "Attachable": true,
    "Containers": {
        "coolify-proxy":     "192.168.240.2/20",
        "dozzle":            "192.168.240.3/20",
        "prometheus":        "192.168.240.4/20",
        "redis":             "192.168.240.5/20",
        "rabbitmq":          "192.168.240.6/20",
        "postgres":          "192.168.240.7/20",
        "monitoring-nginx":  "192.168.240.8/20",
        "scheduler-worker":  "192.168.240.9/20",
        "ai-worker":         "192.168.240.10/20",
        "backend":           "192.168.240.11/20",
        "frontend":          "192.168.240.12/20"
    }
}
The Critical Discovery
Look at monitoring-nginx. It's on all three networks:
| Network | IP Address |
|---|---|
monitoring |
192.168.80.4 |
internal |
192.168.96.5 |
| Coolify default | 192.168.240.8 |
Now look at dozzle. It's on two networks:
| Network | IP Address |
|---|---|
monitoring |
192.168.80.2 |
| Coolify default | 192.168.240.3 |
But critically, dozzle is NOT on the internal network.
Now look at the Traefik log again:
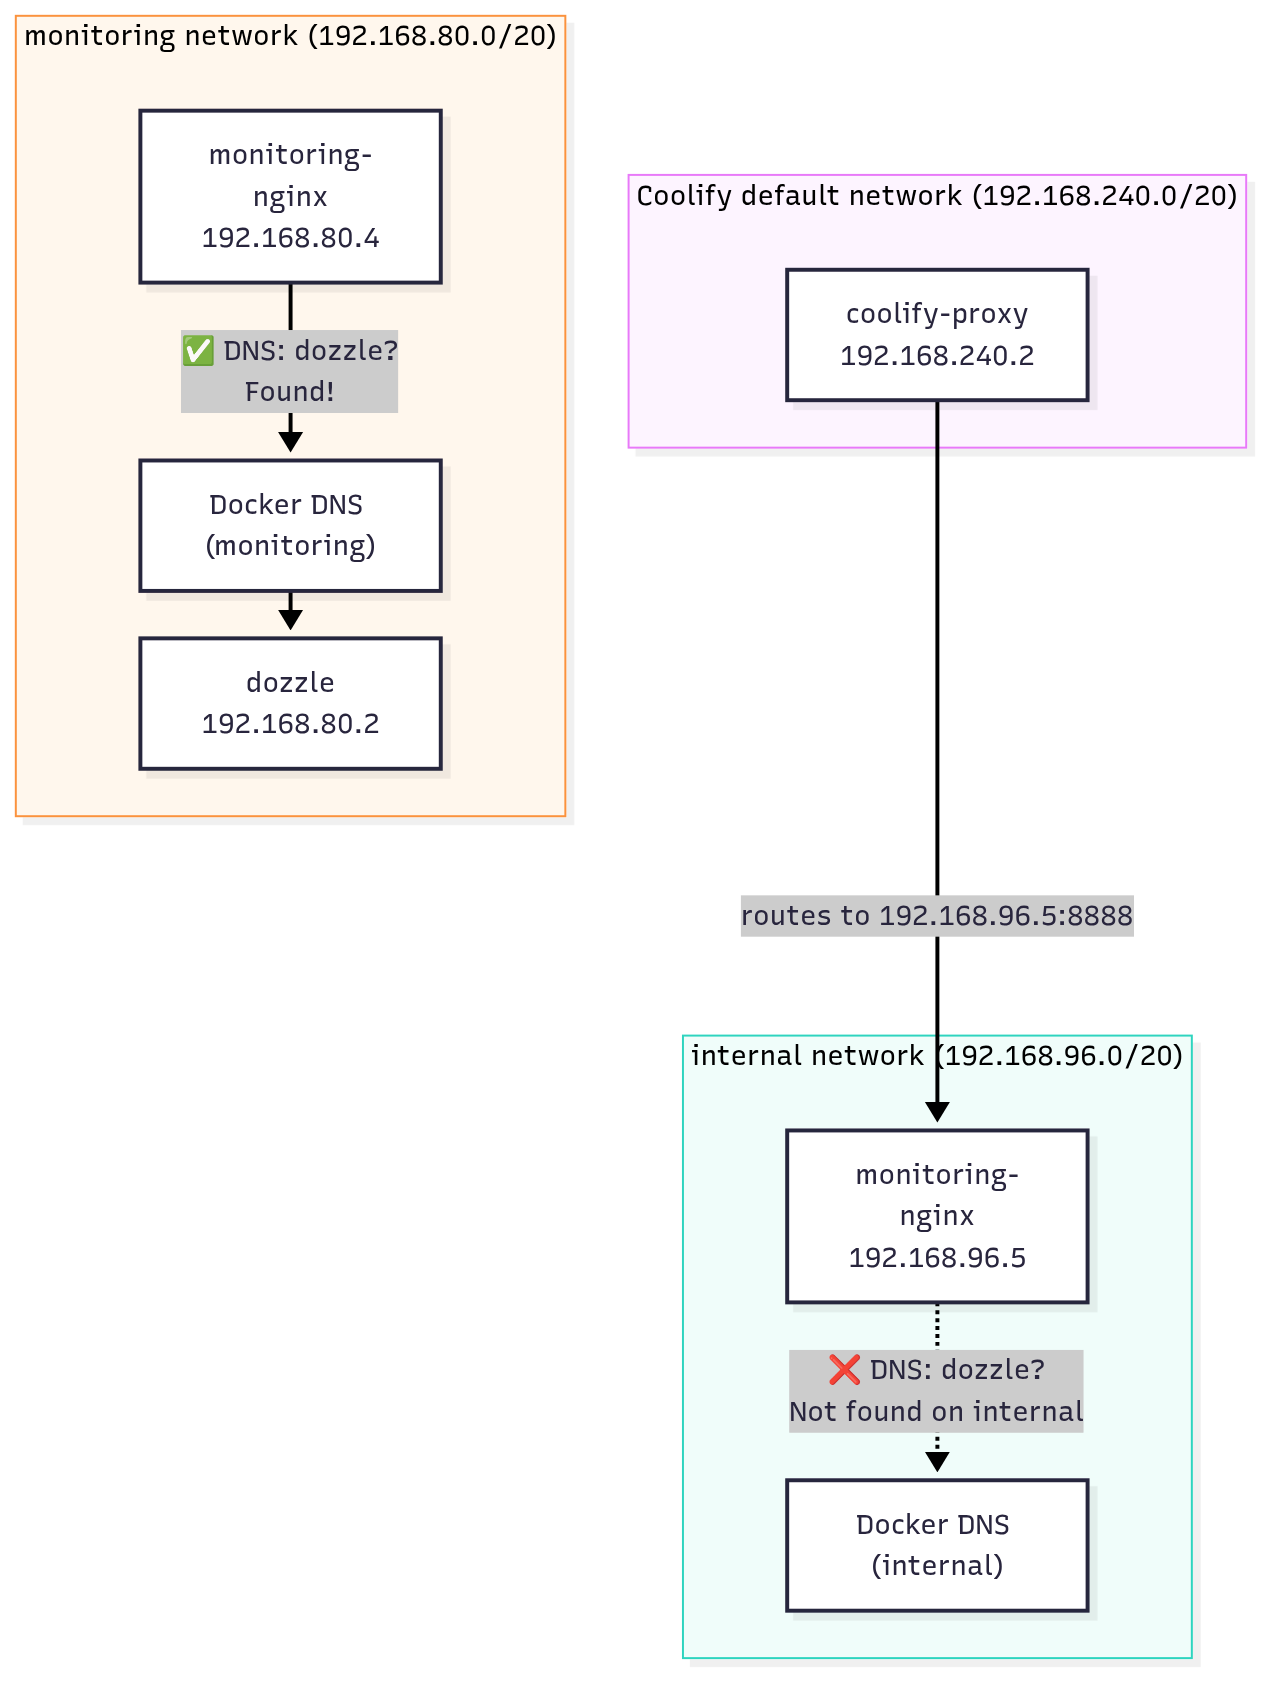
That IP — 192.168.96.5 — is monitoring-nginx's address on the internal network. Traefik (the Coolify proxy on 192.168.240.2) routed the request to monitoring-nginx via its internal network interface.
The "Aha!" Moment
The report mentionned:
monitoring-nginx is on two networks: internal and monitoring. Coolify added another network that is external, and on each network, monitoring-nginx has a different IP address. In the logs provided, Traefik required the IP address of internal, but dozzle is in monitoring network.
This was the key insight.
Root Cause: Docker's Per-Network DNS Scope
Docker's embedded DNS server resolves container hostnames per-network. When a container is attached to multiple networks, it gets a separate DNS resolver context for each one. The DNS resolution is scoped to the network the request arrives on.
Here's what was happening step by step:
- Traefik (on
192.168.240.2) routes the request tomonitoring-nginxvia itsinternalnetwork IP (192.168.96.5:8888). - The request arrives at Nginx on the
internalnetwork interface. - Nginx tries to resolve
dozzlevia Docker DNS. - Docker DNS scopes the query to the
internalnetwork — the network the TCP connection came in on. dozzleis not on theinternalnetwork — it's only onmonitoringand the Coolify default network.- DNS resolution fails → Nginx can't connect → TCP connection timeout → 504 Gateway Timeout.
Why It Was Intermittent
If the request happened to arrive via the monitoring network interface instead (e.g., if Traefik resolved the 192.168.80.4 IP), DNS resolution would work fine. This explains why the issue might have seemed flaky — it depended on which IP Traefik happened to use for routing.
The backend Container Was Also Affected
Notice that backend is also on both internal and monitoring networks. If backend ever needed to reach dozzle or prometheus by hostname, it would face the same issue depending on which network the request originated from.
The Fix: One Network to Rule Them All
The solution was to consolidate everything onto a single internal network. This is actually what our development Docker Compose file (docker-compose.yml) already did correctly — all services including monitoring were on the default network with no explicit network isolation.
The changes in docker-compose.coolify.pull.yml:
  prometheus:
    networks:
-     - monitoring
+     - internal

  dozzle:
    networks:
-     - monitoring
+     - internal

  monitoring-nginx:
    networks:
-     - internal
-     - monitoring
+     - internal

networks:
  internal:
    driver: bridge
    internal: true
- monitoring:
-   driver: bridge
Why This Works
With all services on the same internal network:
- Docker DNS can resolve any service name from any container. No more scoping ambiguity.
- There's no ambiguity about which network a DNS query belongs to. Every container has exactly one DNS context.
- The
internal: trueflag still provides network isolation — no external access to these containers from the host. This is the same security property themonitoringnetwork provided.
Why Not Keep Two Networks?
You might ask: "Couldn't we just add dozzle and prometheus to the internal network too, keeping both networks?"
Yes, that would also fix the DNS issue. But having two separate bridge networks with the same isolation properties adds unnecessary complexity with zero security benefit. A single internal network is simpler, easier to reason about, and eliminates this class of bug entirely.
What About the Coolify Default Network?
The Coolify default network (192.168.240.0/20) is automatically created by Coolify and attaches all containers for Traefik routing. We didn't touch this — it's managed by Coolify and necessary for the proxy to reach services. The key fix was ensuring that dozzle and prometheus are on the internal network so that monitoring-nginx can resolve them via DNS regardless of which interface the request arrives on.
Lessons Learned
1. Docker DNS is per-network
This is the most important takeaway. When a container is on multiple networks, Docker's embedded DNS resolves hostnames only within the network context of the incoming request. A container cannot resolve hostnames from another network, even if it's attached to both.
2. Multi-network containers have multiple personalities
A container on two networks has two IP addresses, two DNS contexts, and potentially different routing behavior depending on which interface a request arrives on. This can lead to subtle, hard-to-reproduce bugs. In our case, monitoring-nginx had three IP addresses:
Each one behaves differently for DNS resolution.
3. The gzip errors were a red herring
The Traefik logs also showed:
{
  "level": "debug",
  "middlewareName": "gzip@docker",
  "error": "mime: no media type",
  "message": "Unable to parse MIME type"
}
These were symptoms, not causes. Traefik was trying to compress responses that had no Content-Type header — which happens when the upstream returns an empty response or the connection is already dead. Always look past the noise to find the real signal.
4. Logs tell a story if you read them together
The access log showed the 504 and the upstream IP (192.168.96.5). The Traefik log showed the i/o timeout. The Docker network inspection showed which containers were on which networks. Each piece alone was confusing — together, they told the complete story.
5. docker inspect is your best friend for network debugging
The docker inspect command on a network shows you exactly which containers are attached and their IP addresses. Cross-referencing this with your reverse proxy logs is the fastest way to spot network scoping issues.
The Debugging Checklist
If you encounter a similar 504 with Docker and a reverse proxy, here's a systematic approach:
-
Check if the upstream container is running
-
Check the upstream container's logs
-
Check the reverse proxy's logs for upstream errors
-
Verify network connectivity from the proxy to the upstream
-
List all Docker networks
-
Inspect each network to see which containers are attached
Look at theContainerssection — this shows every container on that network and its IP address. -
Cross-reference IPs with your logs — if the proxy is hitting one IP but the upstream isn't on that network, you've found the problem.
-
If multi-network, suspect DNS scoping — this is almost always the culprit.
Conclusion
A 504 Gateway Timeout is rarely about the timeout itself — it's about what's preventing the upstream from responding. In our case, it was a Docker DNS scoping issue caused by splitting services across two networks. The fix was simple: consolidate onto a single network.
The next time you see a 504, don't just check if the service is running. Check which network it's running on, and whether the proxy can actually find it. Run docker inspect on your networks — the answer is often hiding in plain sight.